MAPPING THE MODEL RESULTS
FOR/GGR 525
Step 1. Make your final product in ArcMap by first setting up
the map drawing in the Map View.
- Open ArcMap.
- Add the final (or whatever it's called) coverage using the Add
Layer
 button. This must be the coverage with CLASS. I will work with final3
in the following examples.
button. This must be the coverage with CLASS. I will work with final3
in the following examples.
- Right mouse-click final3 polygon in the table of contents and
choose Properties.
- Click the Symbology tab.
- Choose Catagories, and then Unique Values.
- For Value Field choose "CLASS."
- Click the Add All Values
 button so that you can see all the values in the field.
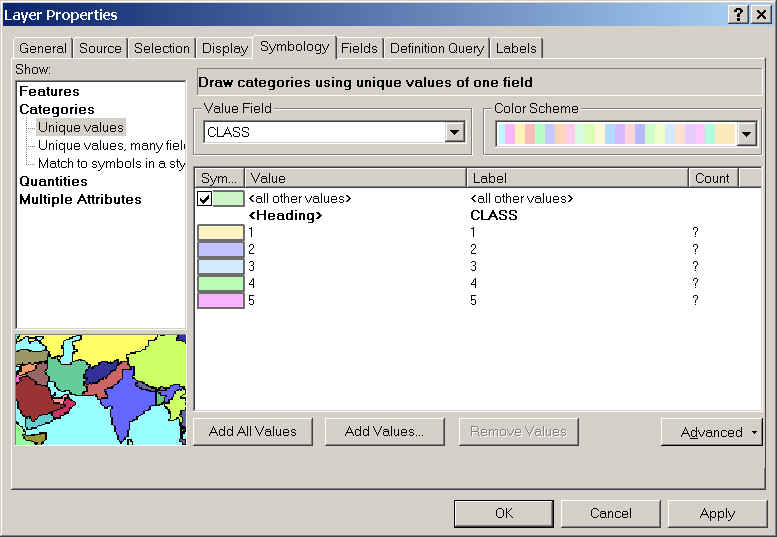
- Choose a different Color Scheme if desired.
Step 2: Change the legend labels in the Map View so that they
look right in the layout.
- Click in the first cell under Label and CLASS and replace
the 0 with "Exclude."
- Click in the second cell under Label and CLASS and replace
the 1 with "Poor."
- In the third cell replace the 2 with "Fair."
- Continue through the rest of the classes in this manner.
- Uncheck the check box for <all other values>.
- Click Apply.
- Change the colors if you want. When you are happy with the map the way it
is, click OK.
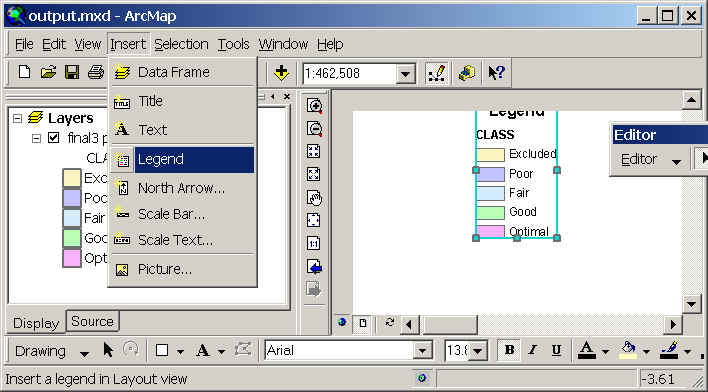
Step 3: Now that the Map View is ready, make the layout.
- Switch from the Map View to the Layout View by clicking the Layout
View icon at the bottom of the map view, i.e. from this:
 to this:
  .
.
- Add the legend by choosing Insert/Legend.
- On the drawing toolbar, click the select arrow so that you can move the
legend to a better location.

- Resize the map window, if necessary.
- Add a north arrow using Insert/North Arrow...
- Add a title and a scale bar.
- Add your name, date, data source, and coordinate system.
- Print the layout. Your final product should look something like this:
Step 4: Repeat the entire process to make a map showing your iterative results.
 Return
to Class Home Page...
Return
to Class Home Page...